


The area of a hazard on a map is different to the area of the corresponding risk.
That’s a simple sounding statement. However, a common error we come across is confusion between a hazard and the risk of a hazard. When building software designed to keep workers safe, this distinction is important.
Let us try and explain, and hopefully help.
A practical example should give you a deeper understanding of what we mean.
Here is a hazard captured by a user on the SaferMe platform:
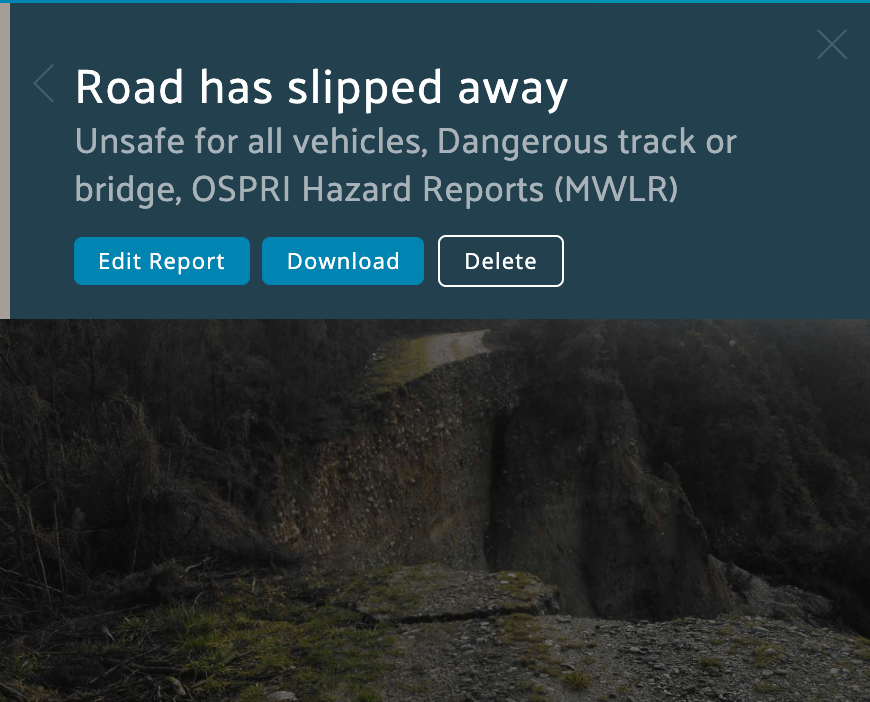
As you can see above, a worker has photographed and tagged a significant hazard on a road. Warning the next worker about this hazard, when they are right on top of it, would be too late.
From a practical perspective, the risk of the slip above is more important to the next worker than the hazard itself, and the risk area is a different shape to the hazard. This “risk area” extends beyond the area of the hazard.
Confused? Let’s delve deeper now, into how risks and hazards can be mapped.
Let’s look at a dangerous weather event, where the same principle applies. Below is a snapshot of the risk of lightning to a worker in Dallas Texas:
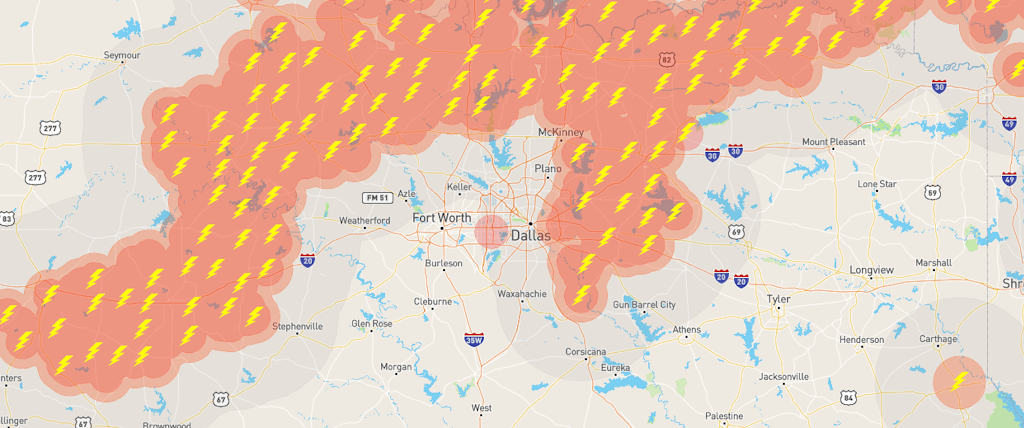
Above is a map that shows the areas with a high risk of a lightning strike to workers. These risk areas need to be communicated to at-risk workers before they are underneath lightning activity.
The different colors above represent triggered risk warnings to the user, and when the worker crosses into a colored area, where they are at risk, they are warned.
The darker red area is where it’s not safe to work if you are a high-wire worker, crane operator, scaffolder, etc.
The companies we meet with often have large databases of hazard locations similar to the above examples. They know their workers need to know about these risks, and sometimes they are already trying to build systems to make their people aware of them. However, a simple map of hazards isn’t enough – but it is the common starting point.
Companies try and map things like:
- Dangerous dog locations
- Asbestos locations
- Extreme weather events
- Crime hotspots
- Cliffs and bluffs
- Chemicals
- Mine shafts and sinkholes
The main point of this post is to try and help those that are trying to “build their own” advanced safety system.
Naturally, as a builder of advanced and off-the-shelf safety apps, we don’t recommend this course of action… but if “it’s too late to turn back now” we’d strongly urge the need to do more than simply map your hazards.
More important for the worker is the risk of each hazard, and this data is not the same shape as the hazard itself.
Background: SaferMe is the world’s specialist builder of engaging safety apps. SaferMe provides pre-emptive risk warnings to workers as they move from place to place, and believes that the future will be incredibly safe, when compared to the danger of today. We’re on a mission to build a global shared database of risk.
To get in contact a SaferMe account manager in your timezone, just go here
Subscribe below to get future posts from SaferMe
We send out emails once a month. We won't share your email with anyone.